For access and deep links, see Accessing the Web UI.
What analysts see (UI layout)
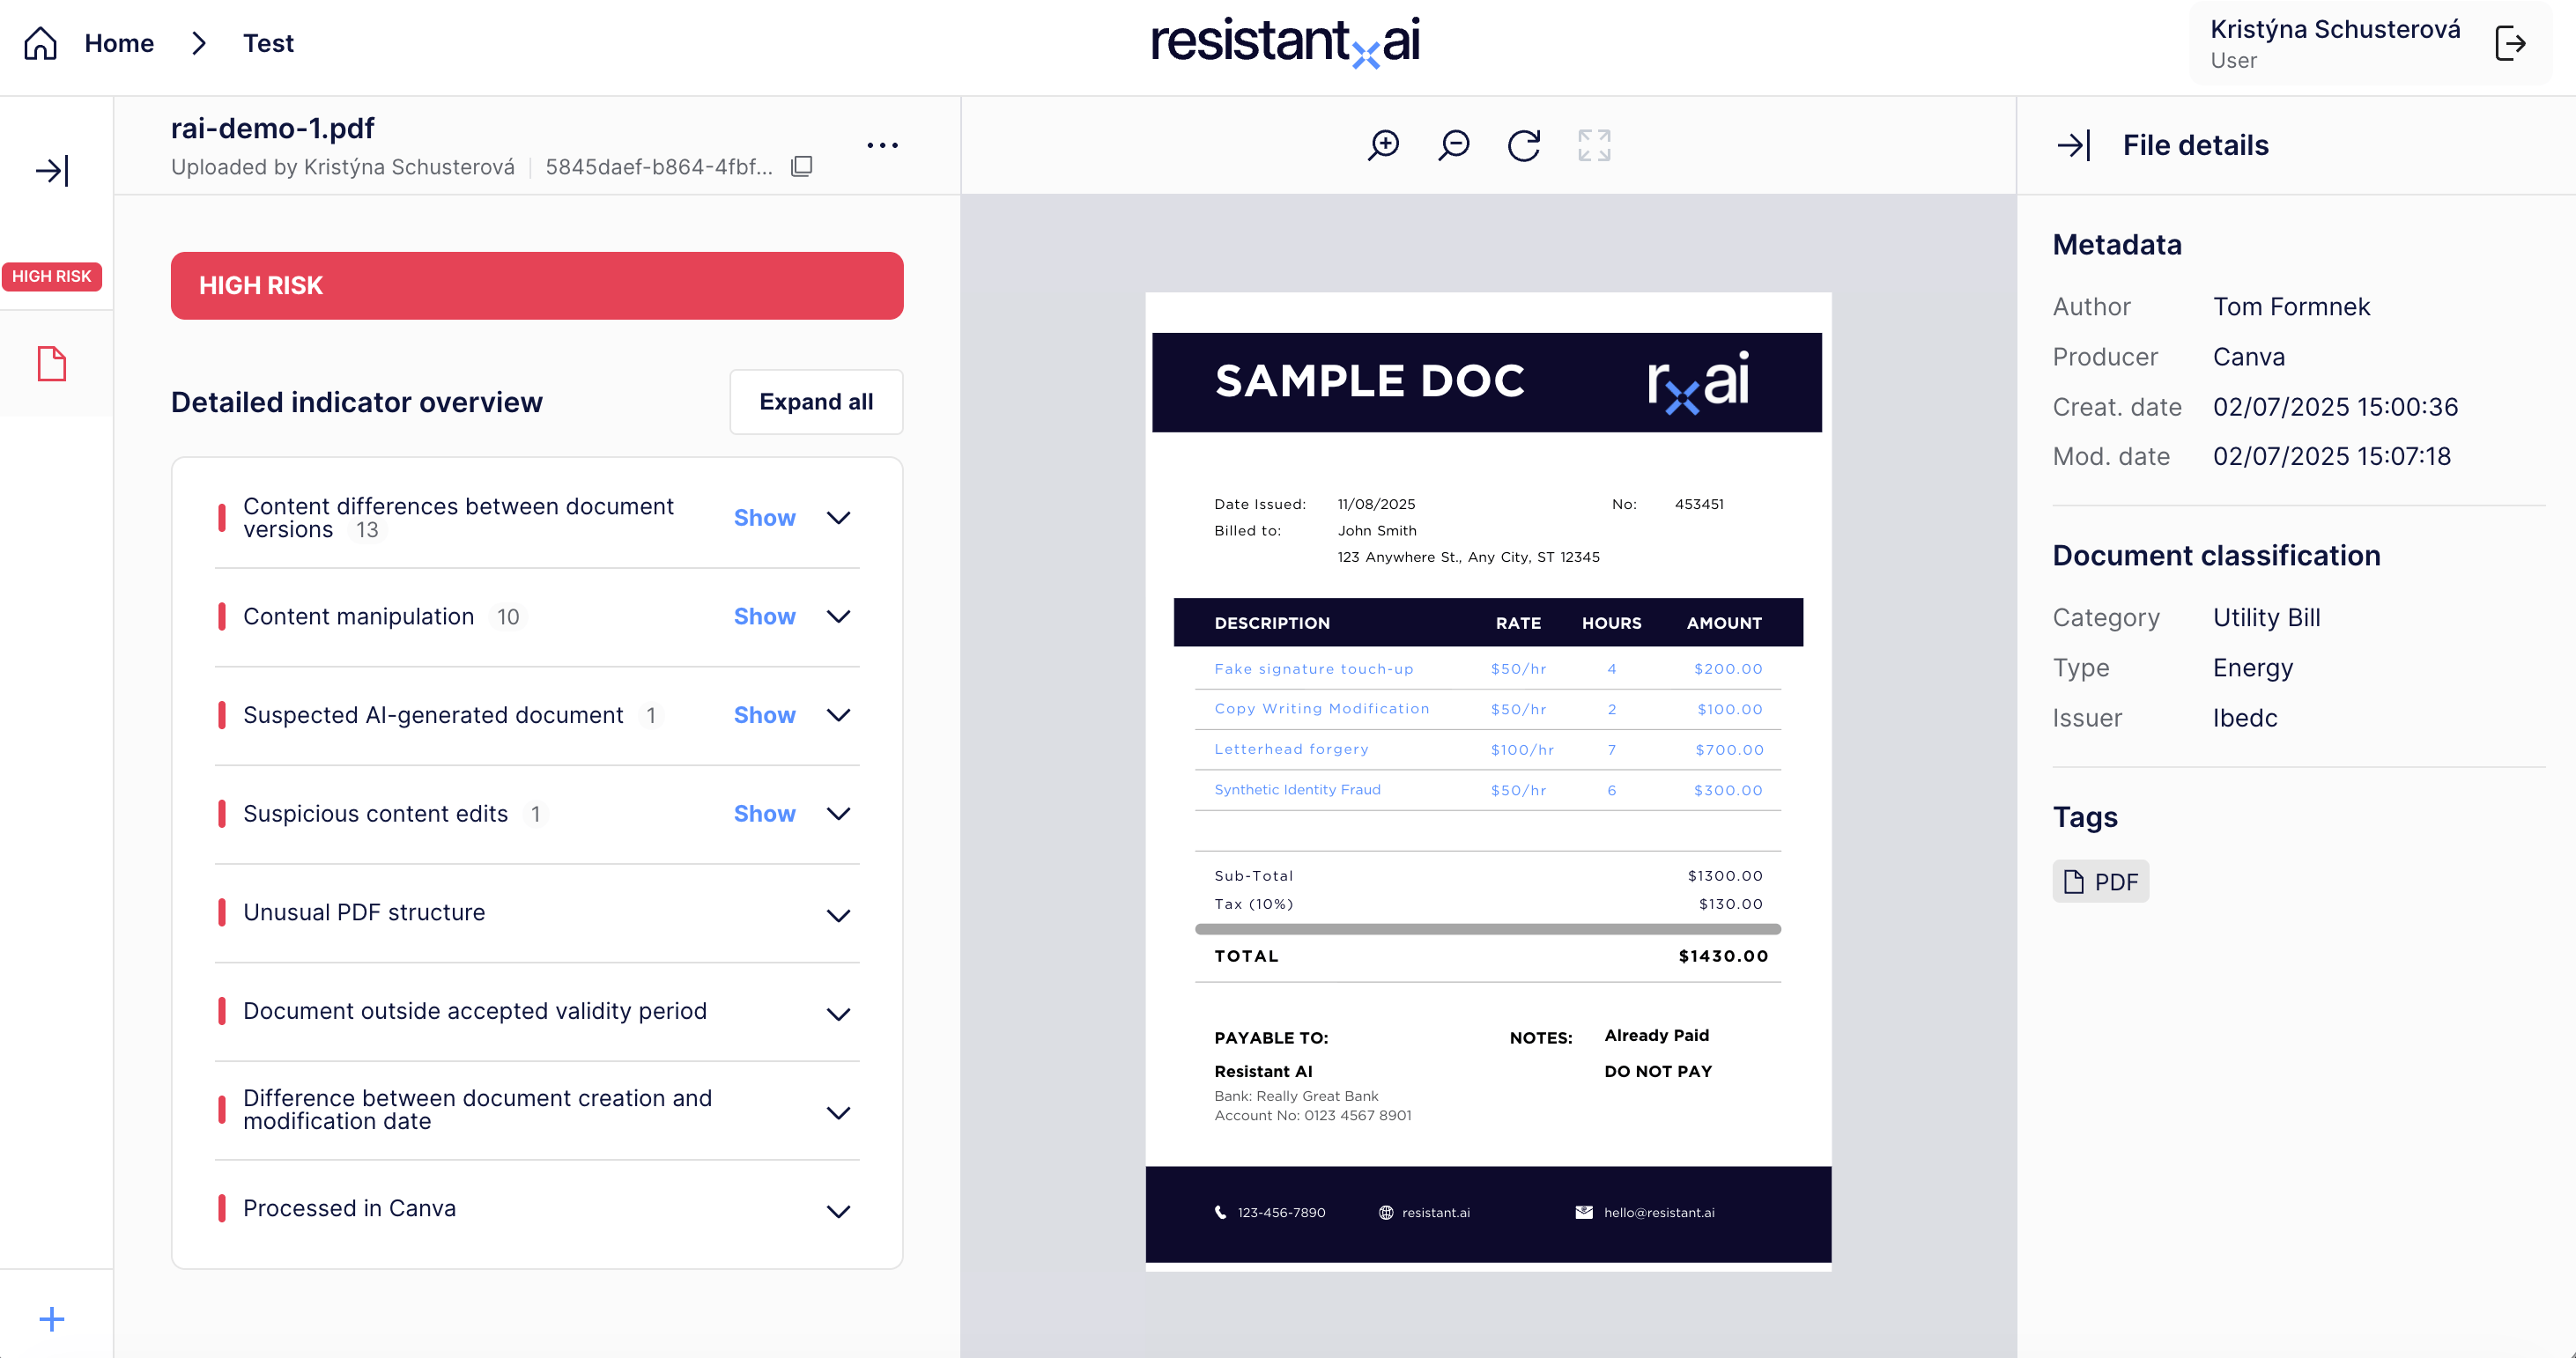
1) Document preview (center)
- The original document is displayed in the main viewing area.
- Analysts use this to visually inspect the document while reviewing findings.
2) Verdict summary
- The UI shows the overall risk/verdict for the document.
- Use this as a triage signal to prioritize review.
3) Indicators list
- The UI lists detected indicators (risk, trust, info).
- Analysts can expand indicators to see details and supporting context.
4) Indicator visualization (“Show”)
Many indicators support a Show interaction that highlights relevant area(s) in the document view. This is the fastest way to connect a finding to evidence.
Not all indicators support visualization. If there is no Show action, review the indicator text and metadata instead.
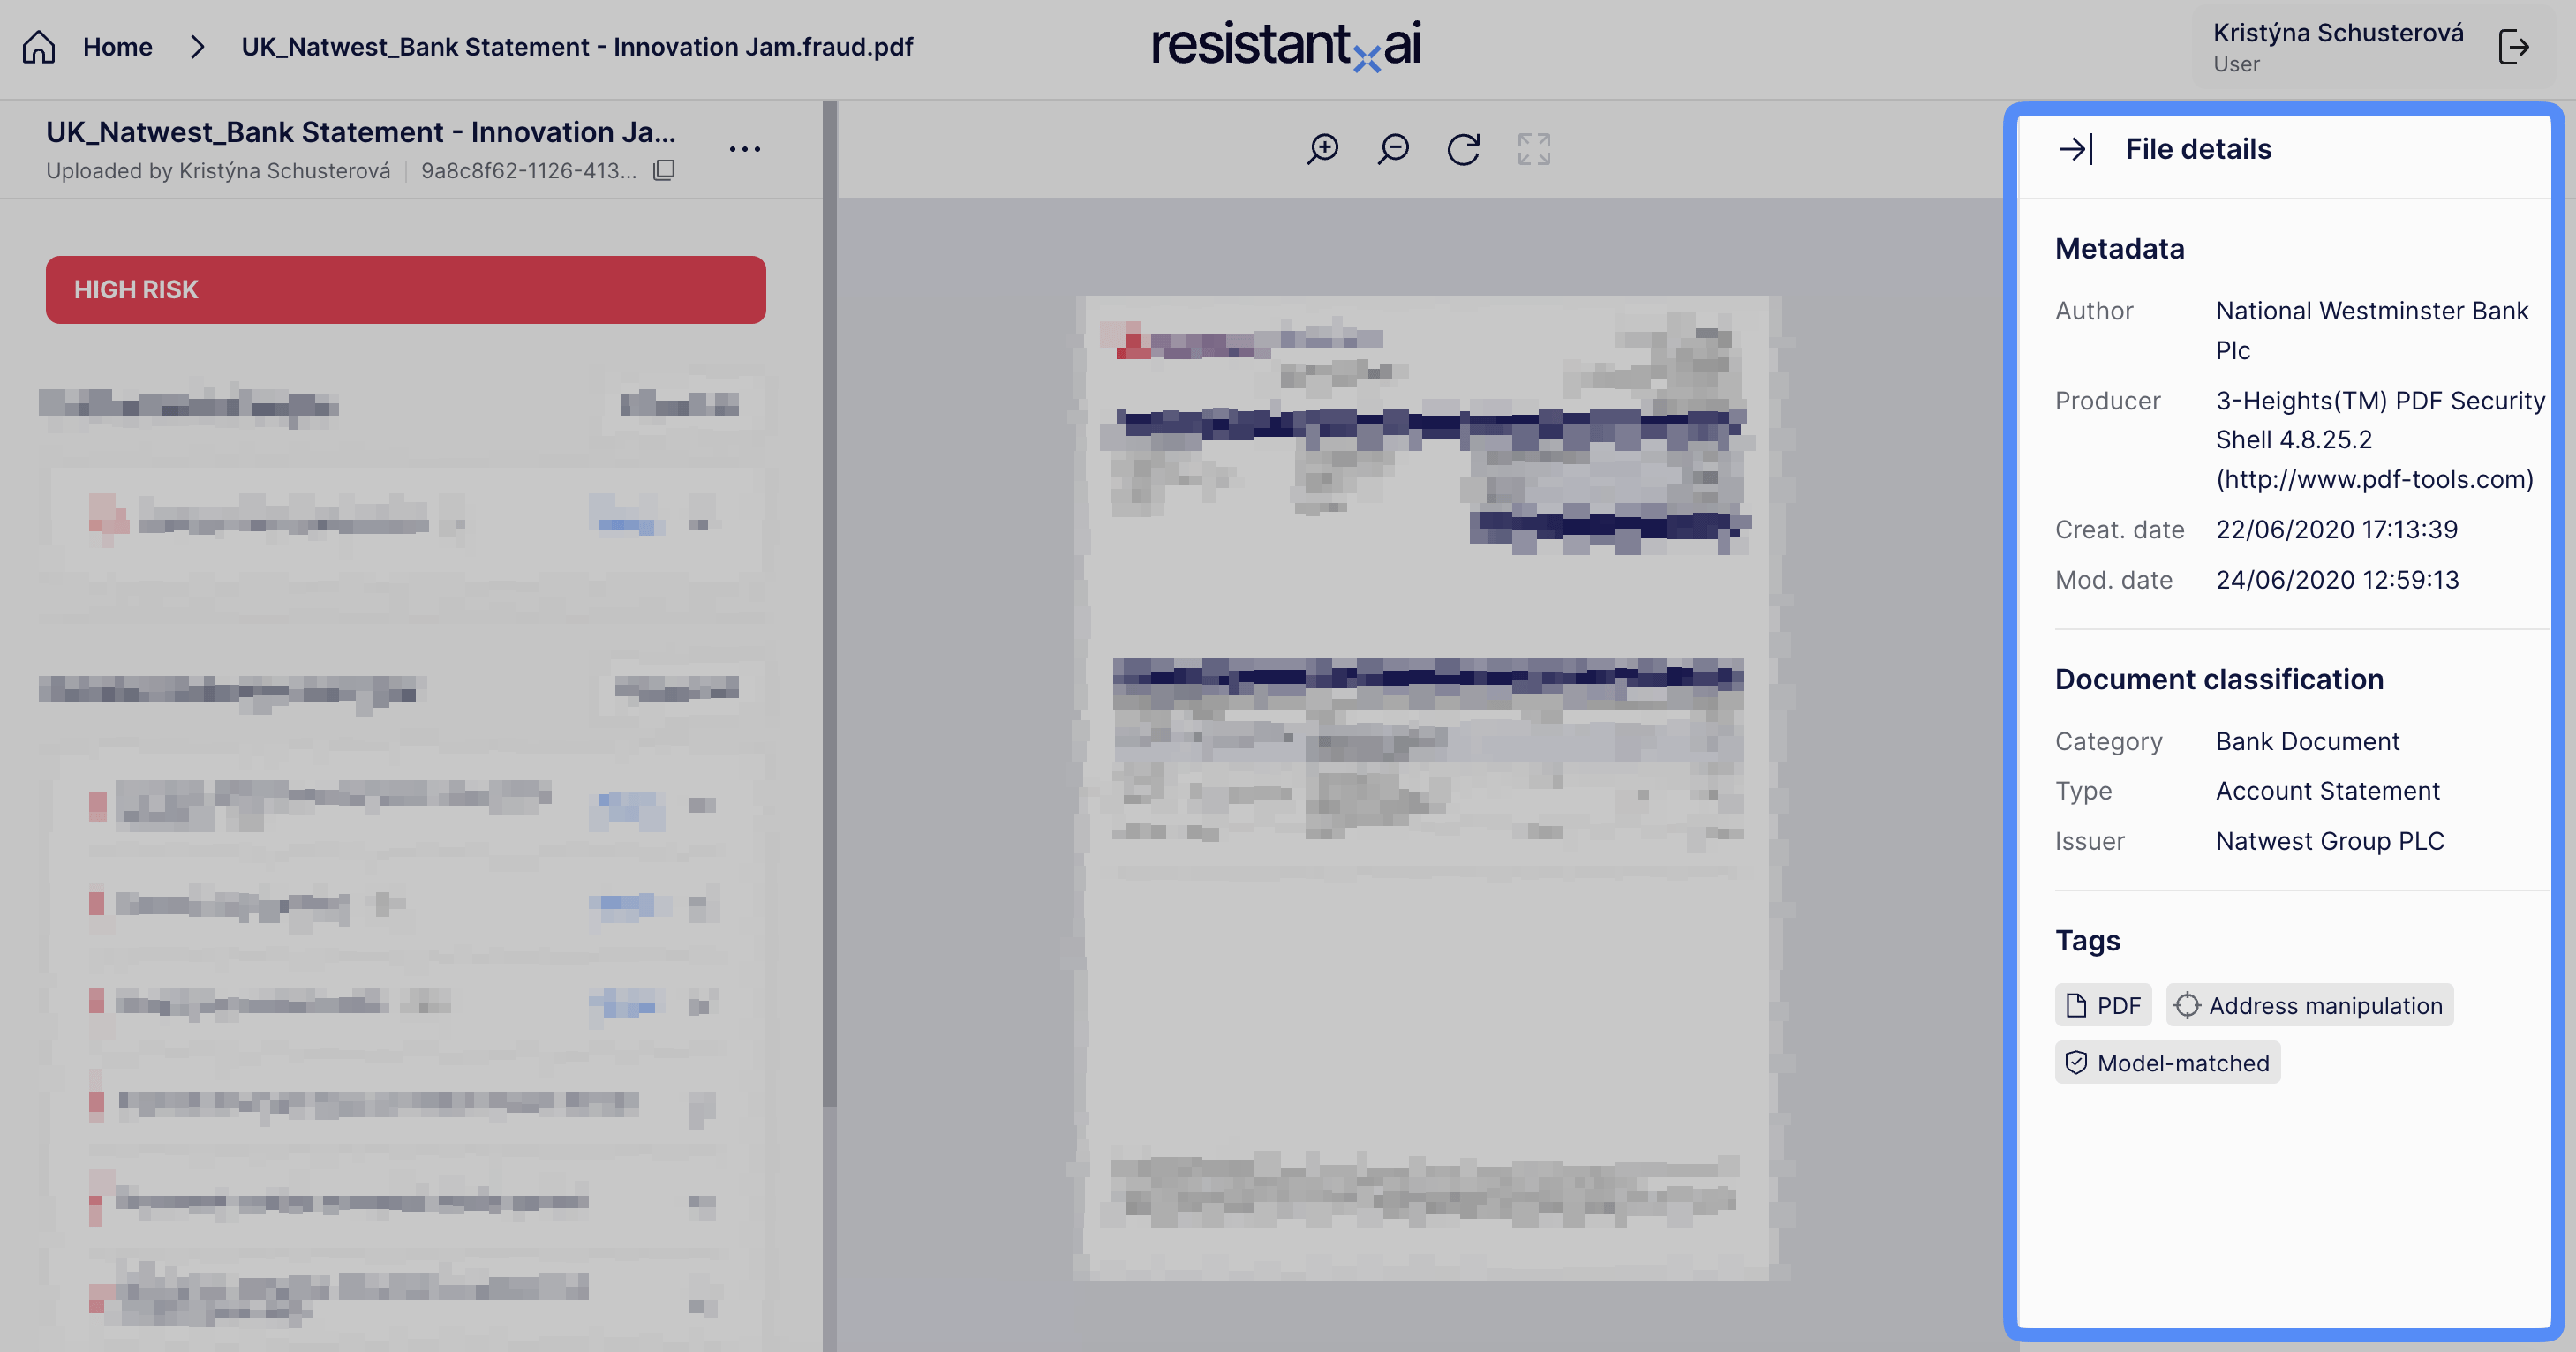
5) Metadata and classification
- Displays extracted metadata and classification-related information (where available).
- Useful for sanity checks and understanding context (e.g., producer/creator metadata, classification output).
Exports and reporting
If enabled for your tenant, analysts can generate/download a PDF report for sharing or audit trails.
Recommended analyst workflow (practical)
- Open the case via deep link:
/analysis/<submission_id> - Check the overall verdict to understand priority
- Review the indicator list from highest impact to lowest
- Use Show to verify evidence in the document
- Review metadata/classification for consistency
- Export a report if required by your process